

Success Stories
Custom Power BI Dashboards: How a Tech Company Gained Real Visibility
A real customer with a real problem. Here's how a tech company with a video learning platform gained reliable reporting from a custom solution after a third-party reporting tool stopped serving them.
A real customer with a real problem. Here's how a tech company with a video learning platform gained reliable reporting from a custom solution vs. a third-party reporting tool that wasn't serving them before.
Disclaimer: For privacy reasons, the company's name was left out of this story, but basic industry profile information was kept for context.
The Challenge
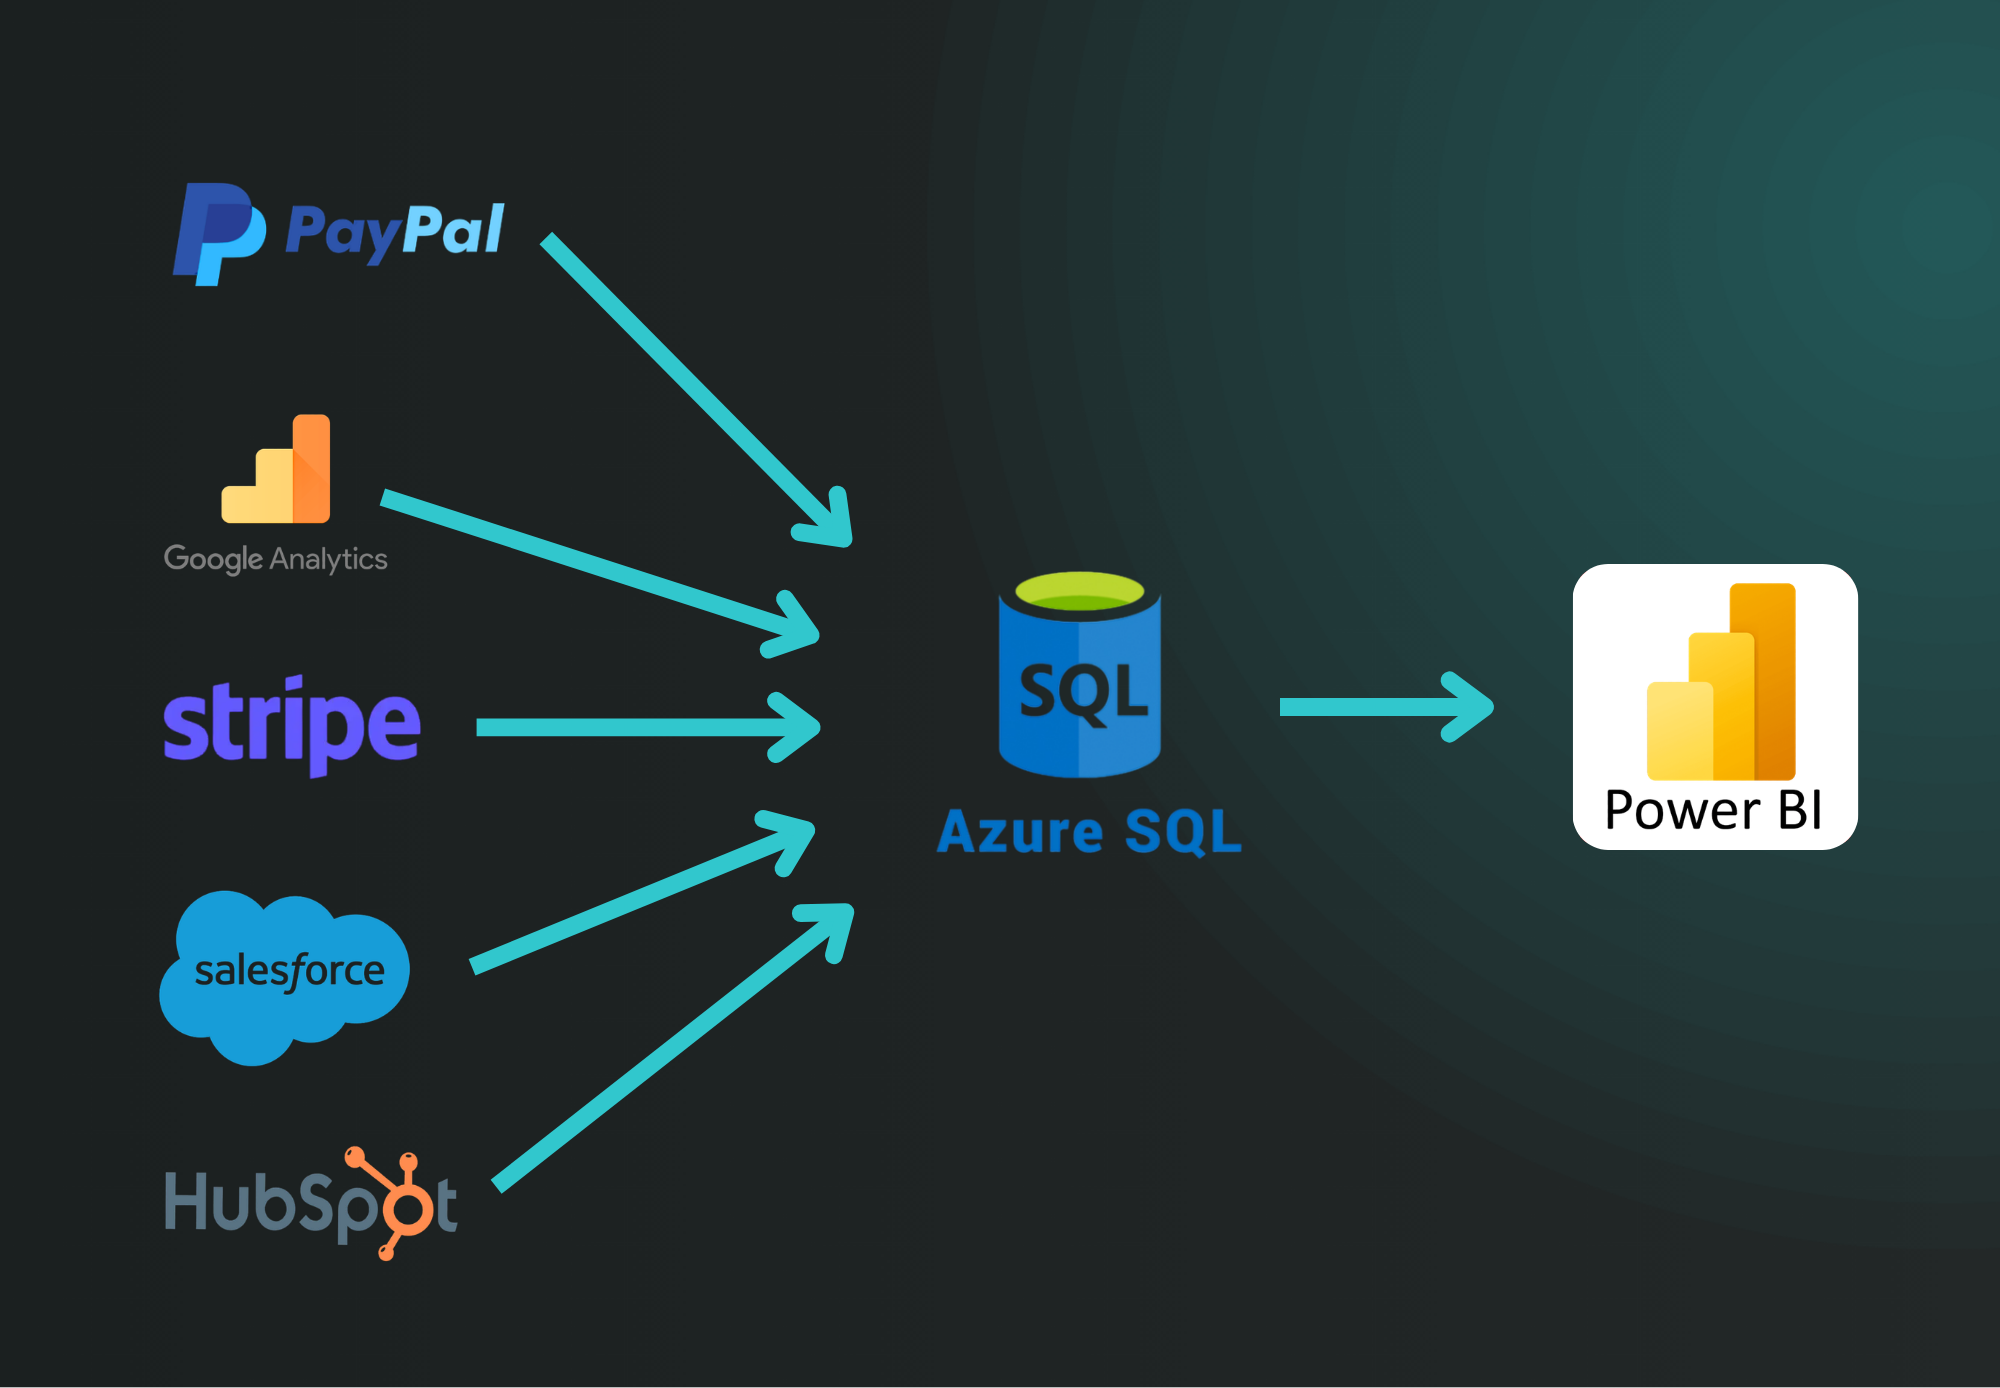
The tech business with a cloud-based video editing platform needed accurate, executive-level reporting, but key data was spread across multiple platforms including two Stripe accounts, Salesforce, HubSpot, Google Analytics, and PayPal. Their existing reporting tool, Baremetrics, did not provide the accuracy or flexibility they needed to confidently measure business performance.
What Was Broken or Unclear
Baremetrics produced inaccurate SaaS metrics and couldn't answer many of the business's reporting questions. Leadership lacked a reliable, centralized view of critical KPIs such as MRR, churn, customer acquisition, retention, and sales performance because the underlying data lived in disconnected systems.
What Xwurk Did
We turned scattered data into clear business insights. Xwurk designed and implemented a custom Azure-based reporting platform. We built the platform to extract data from each source, centralize the data in an Azure SQL database, and develop a comprehensive suite of Power BI dashboards that combined SaaS, financial, marketing, and sales data into a single reporting solution tailored to its business.
What Changed or Improved
The organization replaced inaccurate third-party reporting with a trusted, customized analytics platform. Executives gained real-time visibility into recurring revenue, churn, customer lifecycle metrics, sales pipeline performance, and marketing effectiveness, all from a single source of truth.
What They Gained
The software company gained reliable reporting they could trust to make strategic decisions. By replacing an off-the-shelf analytics platform with a custom solution built around their business, leadership was able to monitor the health of the company more accurately, identify trends faster, and make data-driven decisions with confidence. And the impact was monumental: leadership gained a 360° view of the business, from marketing engagement to recurring revenue, so accuracy improved dramatically, eliminating the reporting gaps of Baremetrics, and it reduced reporting time from days to minutes.
What You Could Gain Too
Does your tech business's data live across multiple platforms, and decision-making still feels like guesswork? Xwurk connects data into clear, trusted business intelligence dashboards, so leaders stop digging through spreadsheets and start seeing performance at a glance. You deserve to trust the numbers you see and not have to waste precious time looking for them. Learn how we can build you a custom solution with KPI reporting, CRM implementation, and revenue operations for better reporting and confident decisions.
Frequently asked questions
Why build custom Power BI dashboards instead of using an off-the-shelf reporting tool?
Off-the-shelf tools report on the data they can see, in the way they were built to see it. When your revenue, marketing, and sales data live in different systems — two Stripe accounts, Salesforce, HubSpot, Google Analytics, PayPal — a packaged tool can't reconcile them, so the numbers drift. A custom Power BI solution centralizes the data first, then reports on it, so you get metrics that match your business definitions.
How long does it take to see results from a custom reporting platform?
It depends on how many sources you're connecting and how clean the data is. In this project the biggest win showed up quickly: reporting that used to take days came together in minutes, because the pipeline pulls and refreshes the data instead of someone rebuilding spreadsheets each cycle.
What SaaS metrics can Power BI dashboards track?
MRR and ARR, churn and retention, customer acquisition cost, customer lifecycle metrics, pipeline and sales performance, and marketing engagement — all in one place. The point is a single source of truth, so leadership isn't arguing over whose number is right.
Do we need a data warehouse to get good dashboards?
Usually, yes, once you have more than a couple of systems. Here we used an Azure SQL database as the central store so each source lands in one place before Power BI reads it. That's what makes the reporting consistent and fast rather than fragile.
Where should we start if our data is scattered?
Start with the questions leadership actually needs answered, then work backward to the systems that hold those answers. Sometimes that means dashboards; sometimes it means fixing the CRM or revenue operations upstream first so the data is worth reporting on.